History as prelude: the outlook for uranium
-
Figure 3: Western world uranium production and requirements history, 1948-2003 -
Figure 11: Historical price changes: a model for the future? -
Figure 2: Production response to price, 1948-1969 -
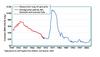
Figure 1: Uranium price, 1947-2004 -
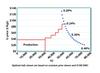
Figure 7: Production-driven price formation -
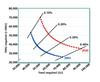
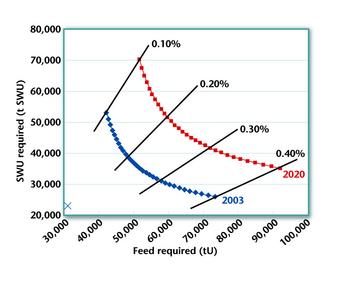
Figure 9: SWU and uranium requirements curves (WNA reference cases) -
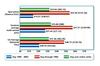
Figure 6: Historical average prices -
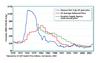
Figure 4: US Average Delivered & Euratom Multi-Annual prices -
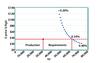
Figure 8: Inventory-driven price formation -
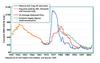
Figure 5: US Average Delivered, AEC and Euratom Multi-Annual prices -
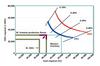
Figure 10: SWU and uranium needed to reach requirements curve