Power Plant Performance
Load factors to end December 2004
14 July 2005By Richard Knox
At the end of December the amount of missing information drops compared with the rest of the year, and 2004 was no exception. Only the Ukraine data and the December figures for British Energy’s AGRs were unobtainable. Most of our readers, even those in other countries, will be aware that, at the time of writing this, the UK has just held a national general election. Britain had the dubious honour of pioneering its own technology for nuclear power and – depending upon how you define ‘commercial’ – was the first to produce commercial-scale electrical power by nuclear heat.
The penalty for going it alone (largely) and first (approximately) was that the system developed was different from most of the rest of the world, and today is certainly older. The oldest Magnox reactor still in operation had achieved just less than 40 years operation at the end of 2004. The others were not far behind, and six of the eight Magnox stations still in operation head the list of ‘oldies’. Even the sprightly young Wylfa will not see 34 again! Although their performance has been declining in recent years, a great deal of energy is still being produced, especially compared with the miserable output from the UK’s politically much-vaunted windfarms.
An increasing number of people appear to have awakened to the fact that the targets set for carbon emissions by governments in countries such as Germany, Sweden and the UK are going to be completely swamped by the corresponding loss of the nuclear power stations’ outputs in these countries. The net gain in carbon emission reduction will be zero, or even become negative.
It seems to be beyond the wit of the energy engineering industries to be able to explain to the public and media at large that if a power station cannot be relied upon to produce something approaching its maximum rated output for most of the time, then it has to be backed up by something that can! It has always been necessary to reduce the costs of producing electricity by generating and transmitting on a large scale from the most reliable sources. Unfortunately, myriad small supplies are relatively inaccessible, and incur very high maintenance and replacement costs. As a result, to date most forms of small-scale renewable energy have been high in both capital and running costs.
In addition, it seems to be beyond the remit of the same industries to be able to explain that Nature’s energy supply is usually much diluted. When this is not so, people are killed in large numbers. Except for geothermal heat, the Sun is the source of all renewable energy (unless someone has proposed harnessing earthquake or tsunami energy – actually not a bad idea from the point of view of energy levels available). Solar energy reaches the surface of the Earth with an average energy density of only a few watts per square metre: it is therefore inevitable that to collect such energy always demands vast areas dedicated to this process. Nothing short of storm force winds and seas, or solar energy at an intensity such as is experienced for half its day on the planet Mercury, is going to fit the bill unless the governments of the day are prepared to devote large areas of land and sea to collecting the energy at ‘normal’ levels. Of course, the competition for land area is growing at a frightening rate simply to house and feed people, and for parking their cars.
All of these things are made more complex and urgent by the background of climate change. Whether greenhouse gas production is a significant cause of global warming or whether it is due to quite feasible longer term variations in the Sun’s output, the continued production of greenhouse gases beyond the rate of our planet’s natural ability to scrub its atmosphere, can only enhance the effects. The chances of checking the continued growth of greenhouse gas production are as thin on the ground as solar radiation. It has become very clear that it is impossible to hope that countries like the United States and Australia will commit themselves to the Kyoto objectives, when the Kyoto signatories themselves are unable to make much impression on their carbon emissions.
It might therefore have been expected that issues of global warming – energy to meet the needs of a modern leading economy, availability of land for agriculture (meaning food, not biomass!) – might have featured in the recent UK elections. This could have been an important platform for the leading political parties in their recent hard working campaigns in the UK. In the event, it was touched upon only by the UK Independence Party which made a faint cry for a renewed nuclear power programme to offset growing dependence on foreign oil and gas, and to reduce carbon emissions.
Now the newly elected government can do all the things it perceives people will hate while there is still time before the next time an election is looming in the public consciousness. Noises have already been made to suggest that the government may indeed be forced to look at this problem, and even to consider nuclear power. Well, it certainly will have to do so, and sooner rather than later.
As in most of the countries, over 30, now running nuclear power stations, the nuclear industry in Britain appears to have done its best to retreat from the public eye and to be left alone while it quietly gets on with the task of shutting down. The industry is way behind in its efforts to improve public information about the success of the technology with the great operating achievement the industry could point to. A miserable performance by the management and in particular the public relations arms of the industry, has failed completely to reach the standards thankfully still shown by their engineering sectors. The independent operators have failed to re-establish the long-standing and mature relationship the old national organisations managed to achieve, by and large. This has led to a growing air of secrecy and apparent self-doubt. In these columns, the good record from all over the world is plain to see. It is most important that nuclear power can demonstrate its potential by complete openness – warts and all.
TablesTable 1. Load factors to end December 2004 PART ONE Table 1. Load Factors to end December 2004 PART TWO Table 1. Load factors to end December 2004 PART THREE Table 1. Load factors to end December 2004 PART FOUR Top ten lifetime electricity generators as at end December 2004 Top ten by lifetime performance to end December 2004 Country averages as at end December 2004 Load Factor Tables
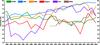
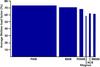
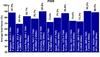 Fig 6. PWR and BWR average load factors over the 12 months to end December 004, for countries with four or more of each type operating.
 Fig 7. Percentage of reactors in the various annual load factor quartiles, to end December 2003 and end December 2004

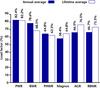
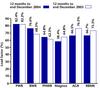 Fig 5. Comparison of load factors for the 12 months to end December 2004 and the 12 months to end December 2003, for the main reactor types.