Simulating an SBO

-
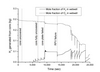
Fig. 6: Mole fraction of H2 and O2 -
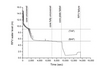
Fig. 3: Water level -
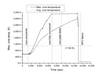
Fig. 4: Core temperature -
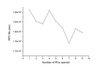
Fig. 9: Effects on RPV life of opening different numbers of RVs at RPV water... -
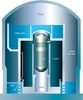
Fig. 1: Schematic diagram of the Kuoshseng reactor building -
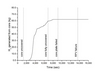
Fig. 5: Hydrogen -
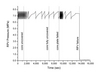
Fig. 2: RPV pressure -
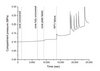
Fig 7: Wetwell pressure -
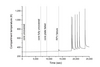
Fig. 8: Wetwell temperature -
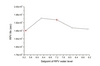
Fig. 10: Effects on RPV life of intervention (by opening only 1 RV) at...