The science of aging well
-
Figure 5: Projected change in steam pressure over operating life -
Figure 7: projected change in scenario bottom line over operating life -
Figure 2: tube plugging assumptions for the example -
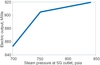
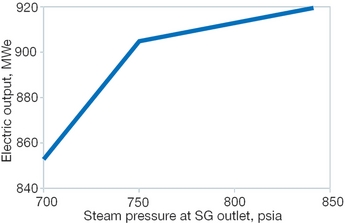
Figure 3: simple turbine generator performance curve used for example -
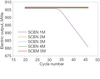
Figure 6: projected change in electric output over generating life -
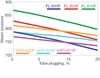
Figure 4: evaluations of steam generator performance of FL & VWO